Predicting House Prices on Kaggle: A Regression Case Study
Nine iterations, five validated features, and one hard lesson: cross-validation improvements do not always mean a better leaderboard score.
The Kaggle Housing Prices competition is a classic entry point into tabular ML: predict home sale prices in Ames, Iowa from 79 features. It's simple enough to be a learning exercise, but has enough structure to reward careful, systematic work over guesswork. Final result: MAE of 13,384.82 on the public leaderboard, rank 209 out of 4,152 — top 5%.
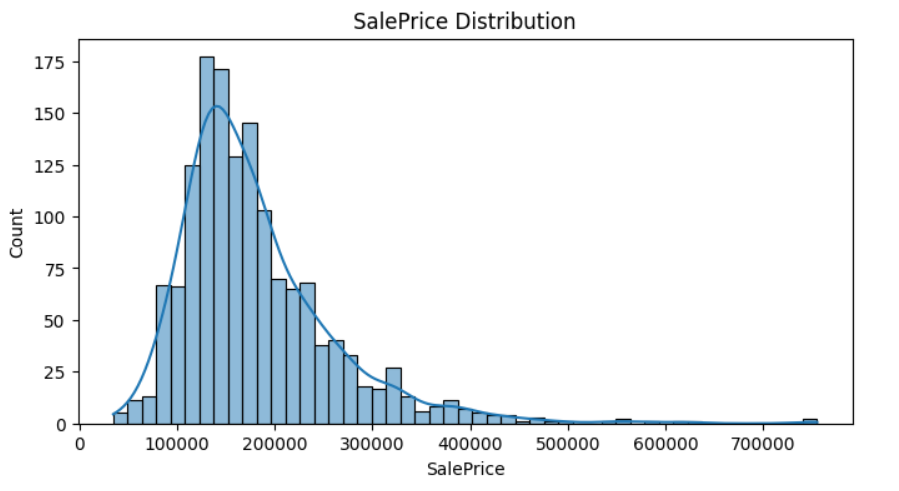
Start with the data, not the model Before touching any model, the EDA surfaced three things that shaped everything downstream. First, SalePrice is right-skewed — a long tail of expensive homes pulls the mean above the median.
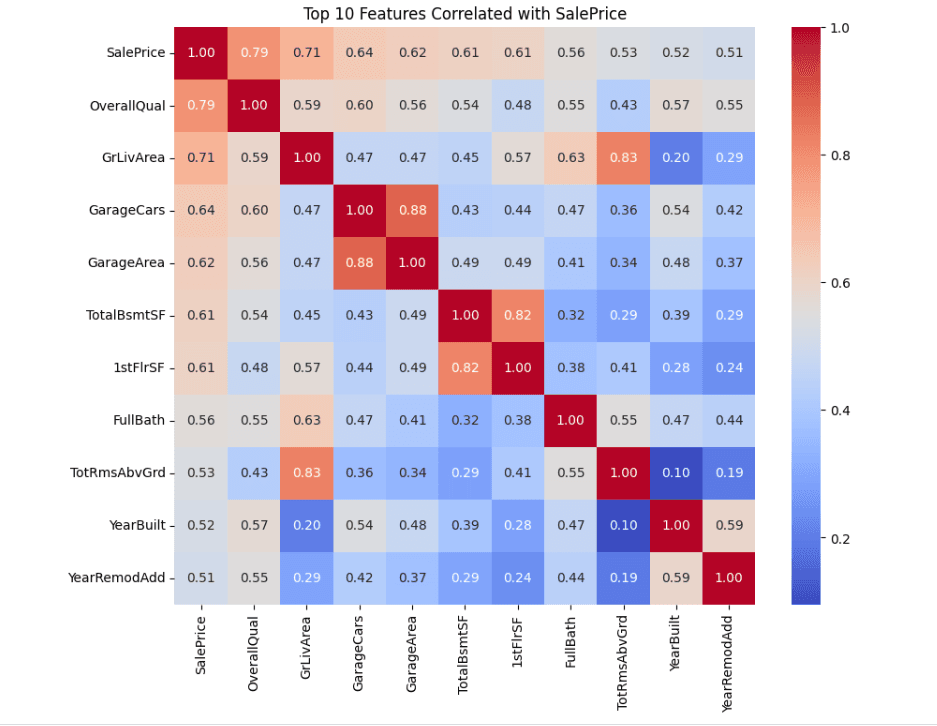
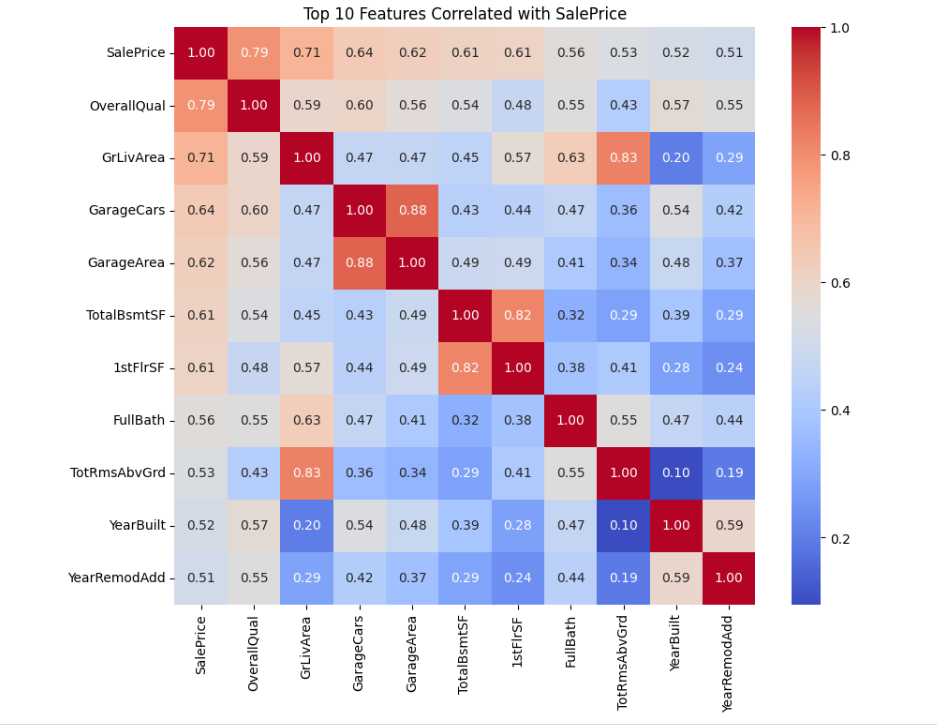
Second, OverallQual and GrLivArea are by far the strongest individual predictors, with correlations of 0.79 and 0.71. Third, several feature pairs are highly collinear (GarageCars and GarageArea correlate at 0.88), which is a strong hint that combining them into one engineered feature is smarter than feeding a model two nearly-redundant columns.
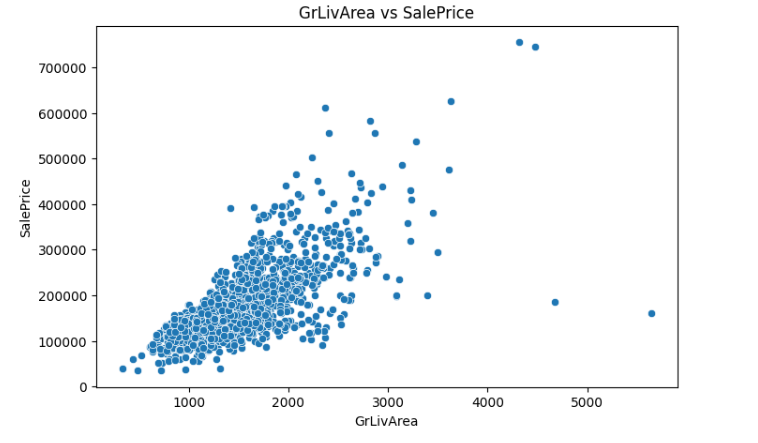
A scatter plot of GrLivArea against SalePrice also revealed a handful of very large homes selling for surprisingly little — these were treated as outliers and dropped from training rather than left to confuse the model.
Missing values are information, not noise A subtle but important preprocessing decision: in this dataset, a lot of "missing" values aren't actually missing. If a house has no pool, the pool-quality column is NaN — not because the value wasn't recorded, but because there's no pool to rate. Filling that with a median or a generic imputation strategy would have destroyed real information. Those columns were filled with the literal category "None" instead, and quality-rating columns (which follow a natural Poor-to-Excellent order) were ordinal-encoded rather than one-hot encoded, so the model could learn the quality gradient directly instead of treating "Good" and "Excellent" as unrelated categories.
Validate every feature individually Eight engineered features were candidates: things like total square footage, a weighted bathroom count, an interaction term between the two strongest predictors, and garage age. Rather than throwing all eight in at once, each was tested individually against a no-engineering baseline using 5-fold cross-validation. Only five actually moved the needle. The other three — house age, years since remodel, and a handful of binary "has X" flags — looked reasonable on paper but added nothing measurable, and were dropped. This individual-validation step turned out to matter a lot: a later experiment that threw in all eight features at once scored worse on the leaderboard despite a better cross-validation number.
XGBoost won, and ensembling didn't help XGBoost was compared against Random Forest, LightGBM, and CatBoost under the same cross-validation setup, and won consistently. The instinct at that point is often to ensemble — average XGBoost with CatBoost, or blend in Random Forest — but every ensembling configuration tested came out worse than XGBoost alone. The other models' errors weren't diverse enough from XGBoost's to add value; they were making similar mistakes, so averaging them just diluted the best model's predictions.
Two rounds of randomized hyperparameter search (30 candidates, then 50, both 5-fold CV) tuned n_estimators, learning_rate, max_depth, subsample, and colsample_bytree, landing on a fairly conservative final model: 1,500 trees, a low 0.02 learning rate, and shallow max_depth of 3.
The lesson that mattered most Cross-validation is a proxy, not ground truth. Log-transforming the target looked like a reasonable idea and showed a negligible CV improvement, but scored worse on the actual leaderboard. The same happened when all eight engineered features were added without individual validation. Both are useful reminders that CV score and leaderboard score are two different estimates of the same underlying thing, and neither is infallible — the only way to know for sure is to test the change and check the real result, not just trust the metric that looks favorable.