Prometheus-Based Monitoring System: Setup, Architecture Analysis and Technical Evaluation
A graduate coursework project covering the setup of a Prometheus-based monitoring system with Docker Compose, its architecture, and a technical comparison against Zabbix and Datadog.
This is a graduate coursework project on cloud computing, covering the setup, architectural analysis, and technical evaluation of a Prometheus-based monitoring system.
Motivation
Modern cloud computing has evolved toward container-based microservice architectures to improve application portability and scalability. Prometheus, one of the first projects (after Kubernetes) to reach "Graduated" status within the Cloud Native Computing Foundation (CNCF), sits at the center of this ecosystem. Unlike traditional monitoring tools that rely on static server configurations, Prometheus models each data point with a metric name and key-value labels, enabling fine-grained, multi-dimensional queries in dynamic environments like Kubernetes.
Architecture
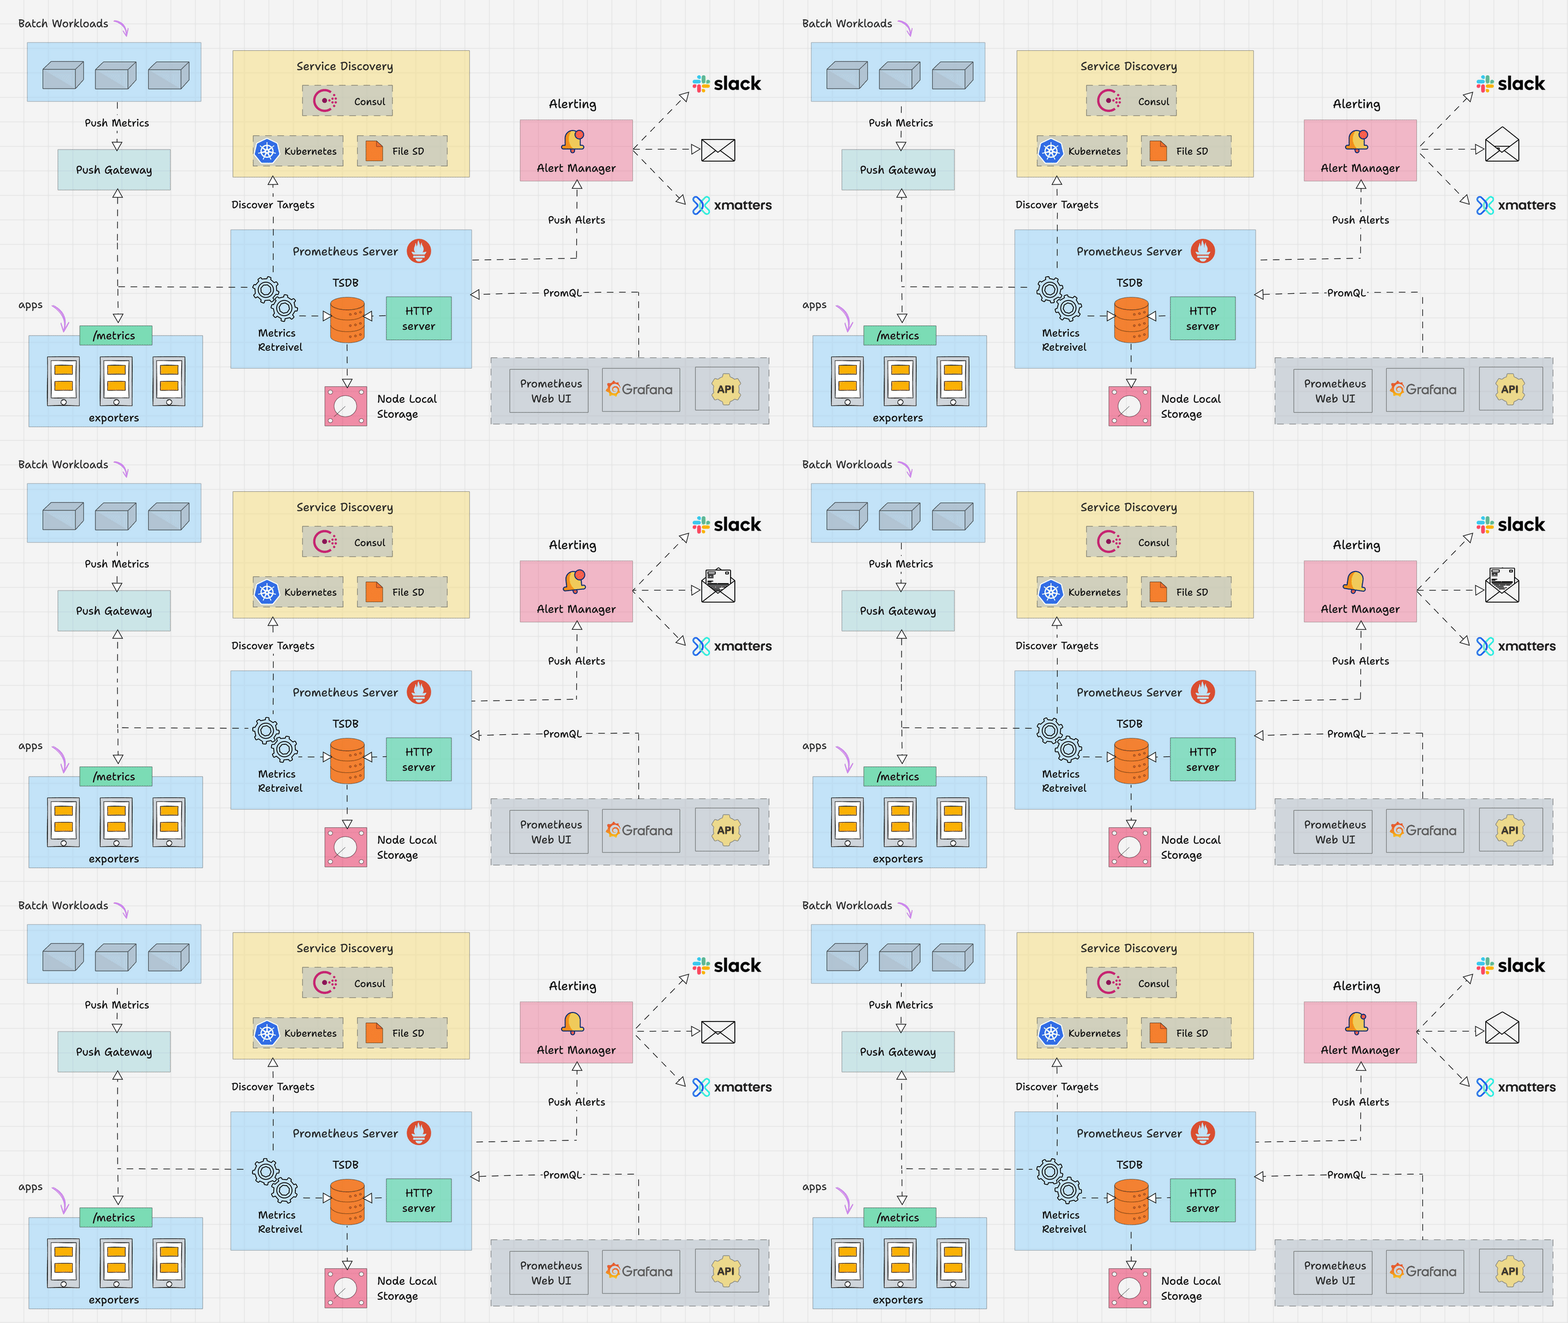
Prometheus architecture is built for high scalability. It uses a pull-based model: instead of waiting for targets to push data, the server discovers targets via service discovery mechanisms and periodically scrapes metrics over HTTP. The core components are:
- Prometheus Server: the "brain" of the system - a Retrieval unit (collects metrics), a TSDB (Time Series Database, stores data with high compression), and an HTTP Server (serves PromQL queries to Grafana or the UI).
- Exporters: translate third-party service metrics (Linux kernel, MySQL, etc.) into a Prometheus-readable format.
- Pushgateway: an intermediary for short-lived batch jobs that do not fit the pull model.
- Alertmanager: groups, deduplicates, and routes alerts to Slack, email, or PagerDuty.
Setup Process (Docker Compose)
The monitoring stack was deployed locally using Docker and Docker Compose, bringing together three services:
- Prometheus (port 9090): collects and stores metrics, configured via
prometheus.ymlwith a 15-second scrape interval. - Node Exporter (port 9100): converts host hardware metrics (CPU, RAM, disk) into Prometheus format.
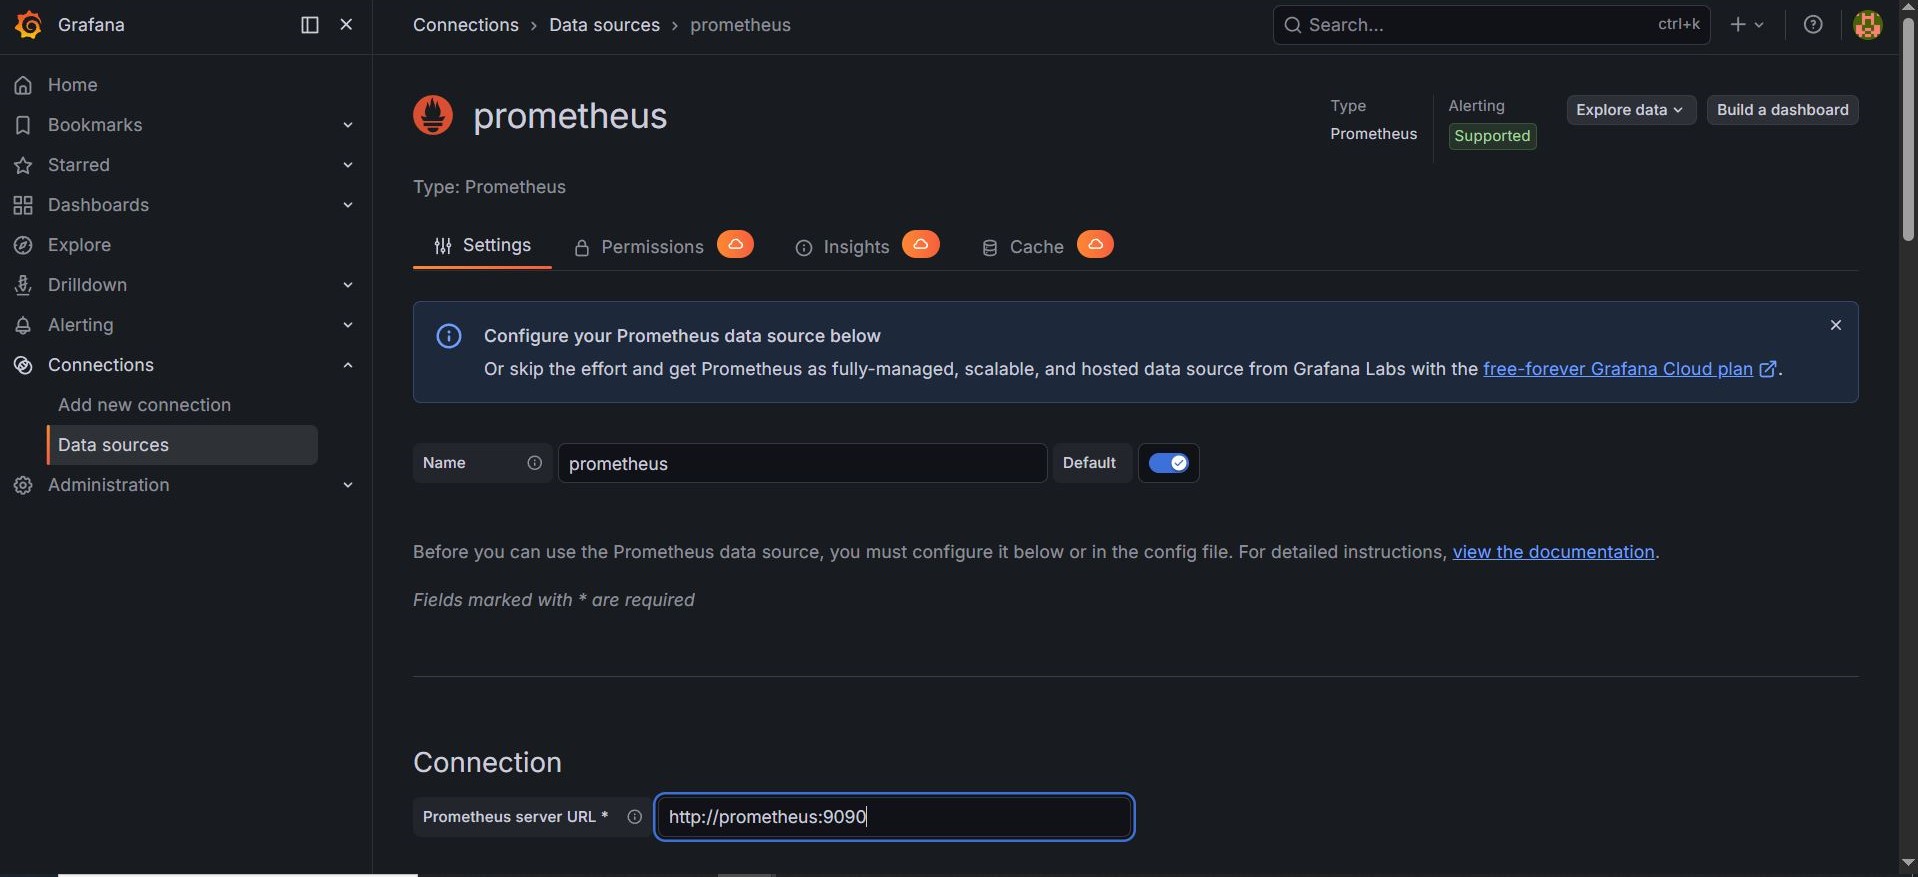
- Grafana (port 3000): visualizes the collected data, configured with
depends_on: prometheus.
Challenges and Solutions
Two issues came up during setup:
- Permission denied: the Prometheus container failed to read its config file. Solved by adjusting file ownership (chown) and Docker volume permissions.
- Network communication failure: containers could not reach each other via localhost. Solved by using Docker internal DNS and referencing services by name (prometheus, node-exporter) instead.
Verification
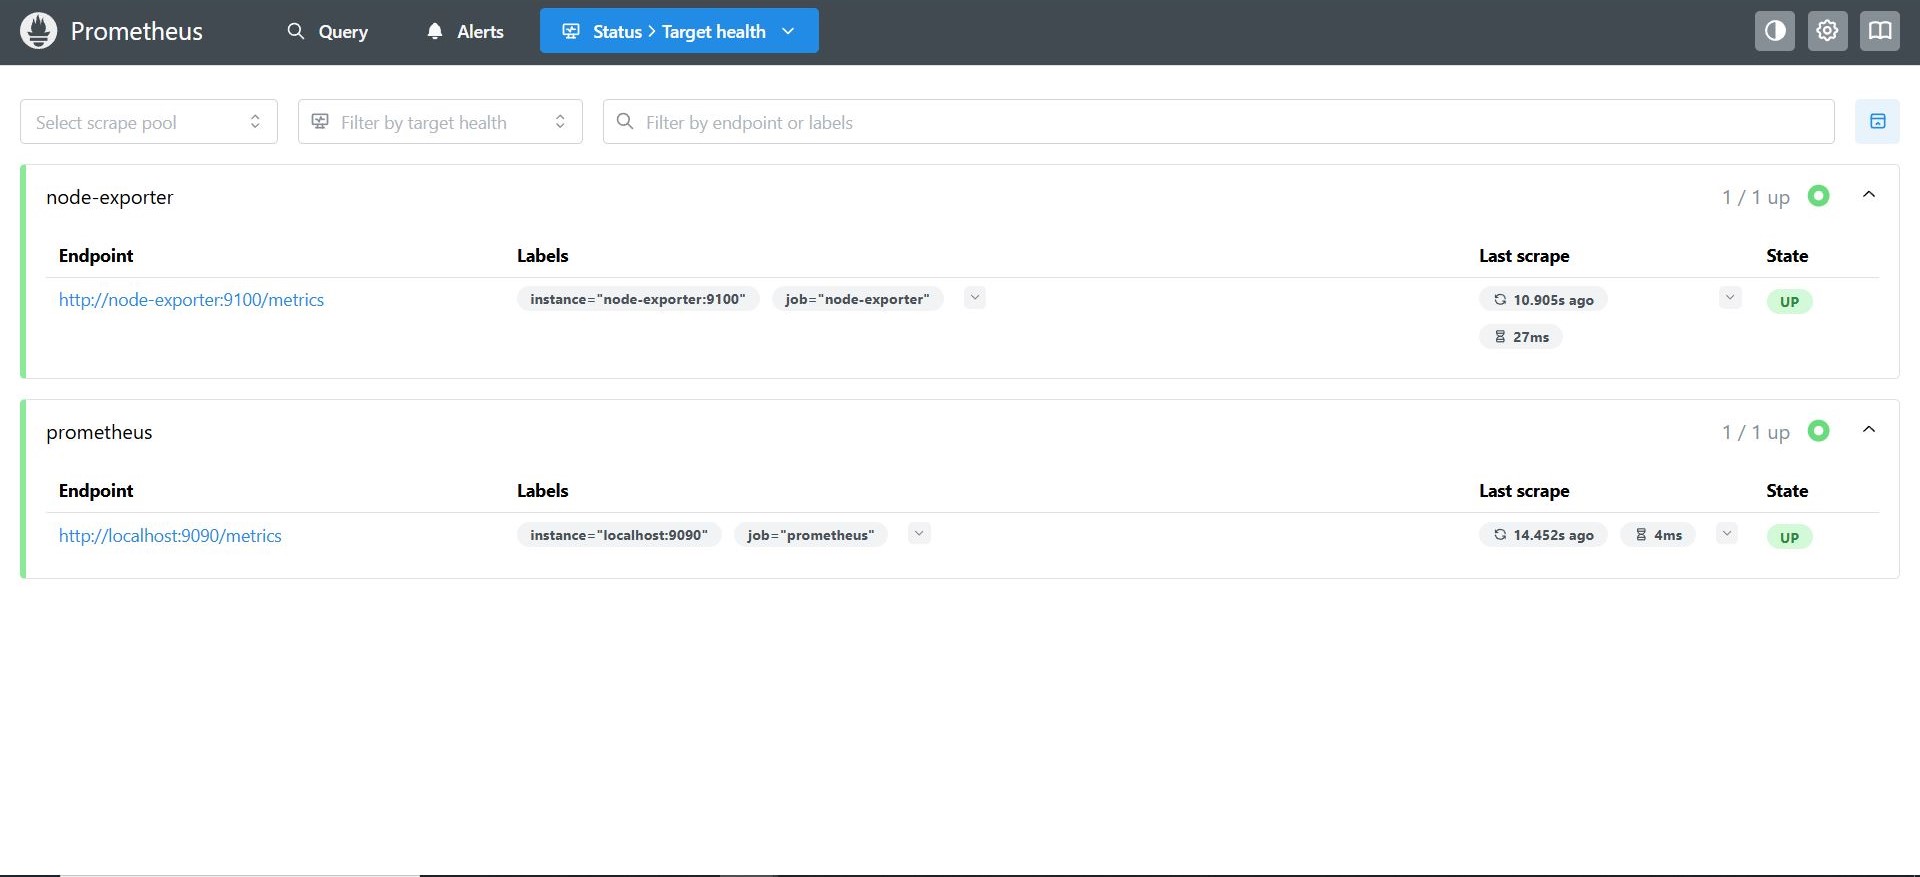
After running docker compose up -d, all three images were pulled and containers started successfully. Visiting the Prometheus UI (localhost:9090) and checking Status → Targets confirmed both endpoints were being scraped successfully and reporting UP status.
Experience and Visualization
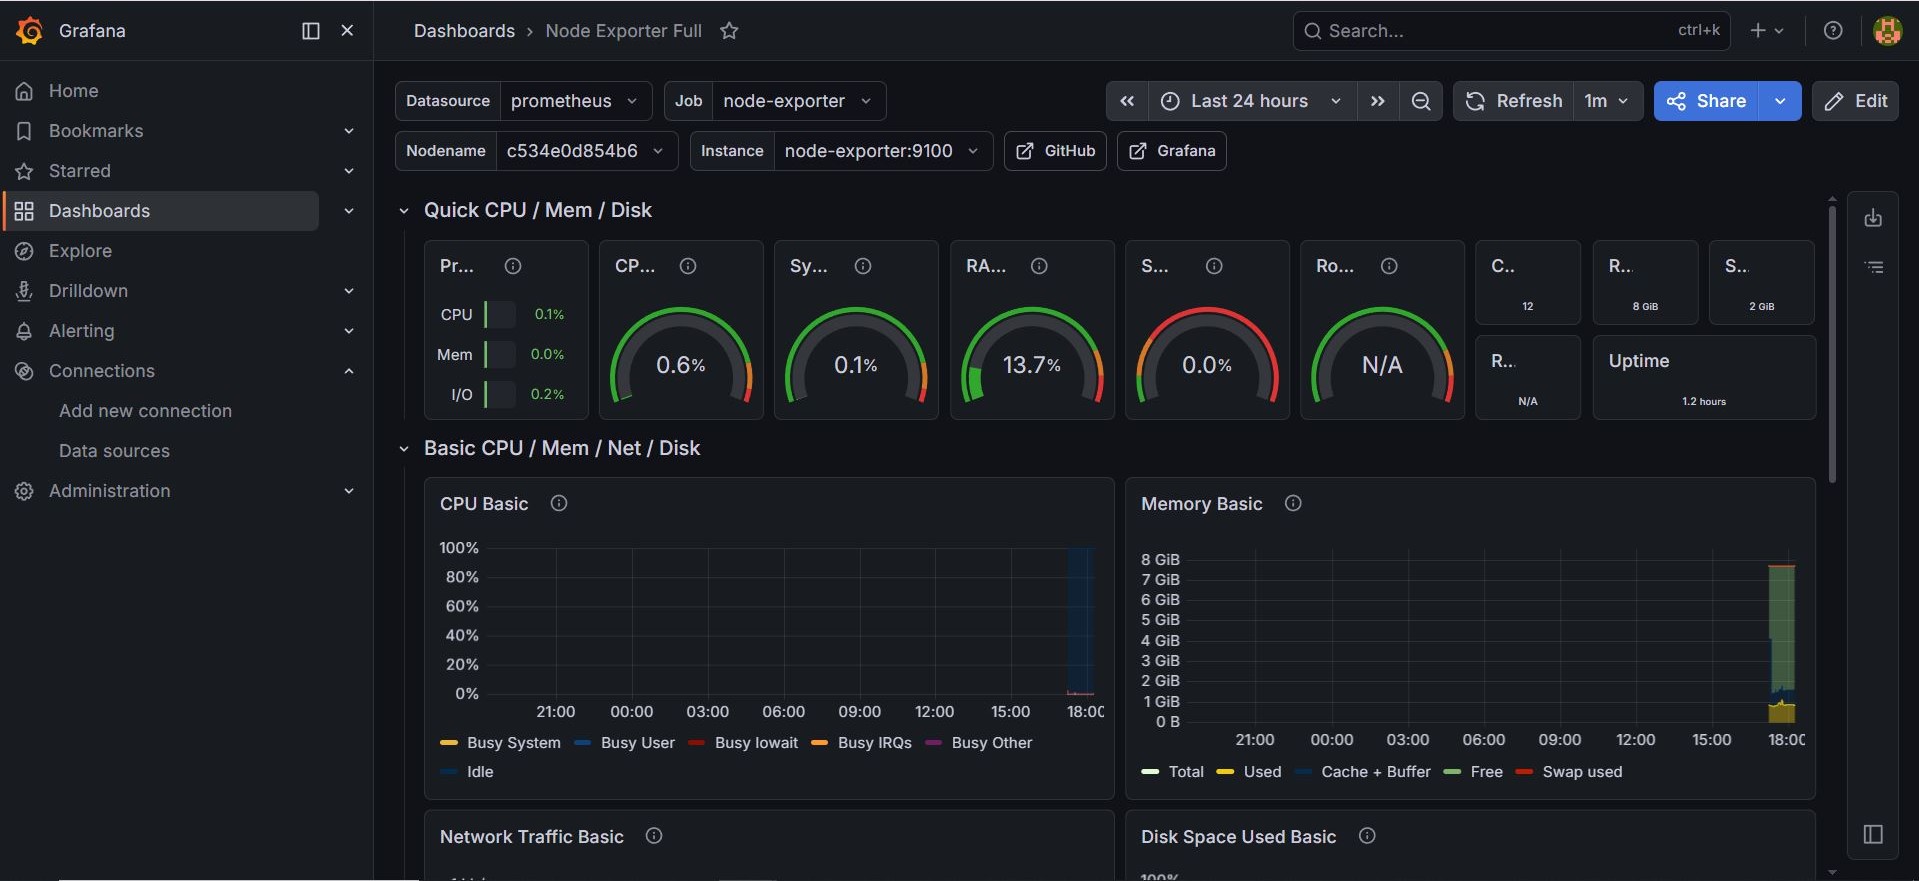
With Prometheus connected to Grafana as a data source and the Node Exporter Full dashboard imported, real-time CPU, RAM, and disk metrics became viewable at second-level resolution, combining PromQL queries with Grafana dynamic dashboard variables.
Comparison: Prometheus vs. Zabbix vs. Datadog
| Criterion | Prometheus | Zabbix | Datadog |
|---|---|---|---|
| Architecture | Cloud-Native | Traditional/Monolithic | Hybrid/SaaS |
| Data Collection | Pull | Push & Pull (mostly Push) | Push (agent-based) |
| Data Model | Multi-dimensional (Labels/TSDB) | Relational (RDBMS) | Multi-dimensional (Tags/SaaS) |
| Service Discovery | Fully automatic (K8s-native) | Partial/Manual | Automatic |
| Learning Curve | Medium (PromQL) | High (complex UI) | Low (user-friendly) |
| Cost | Free (open source) | Free (open source) | Paid (per metric) |
| Community | Very strong (CNCF Graduated) | Strong (established) | Enterprise support |
Strengths and Weaknesses
Strengths:
- Dynamic service discovery - automatically tracks new targets in constantly scaling microservice environments.
- Operational simplicity - no external database dependency, high-performance TSDB built in.
- Powerful querying - PromQL enables complex mathematical analysis and anomaly detection.
Weaknesses:
- Not designed for long-term (yearly) data retention out of the box - requires add-ons like Thanos or Cortex.
- Learning curve - teams used to SQL-based querying may find PromQL challenging at first.
Conclusion and Recommendations
For containerized, Kubernetes-based infrastructure, Prometheus is the clear choice thanks to native integration and automatic service discovery. For sectors requiring second-level monitoring resolution (finance, e-commerce), its low-latency data pipeline is a strong advantage. For cost-sensitive or data-sovereignty-focused projects, its fully open-source nature stands out against SaaS alternatives like Datadog. In hybrid environments, a mixed approach - Zabbix for static network hardware, Prometheus for application-level metrics - can maximize operational efficiency.
Prometheus transforms observability from a reactive discipline (responding after failures) into a proactive one (detecting issues before they escalate) - a cornerstone of the modern cloud computing landscape.